Data Suggests Democrat and Republican Voters Both Agree on Climate Change - Are Their Politicians Listening?
New climate risk and voter sentiment data indicates the U.S states with the most severe predicted damage(s) from the climate crisis are doing the least to address it, even though a majority of voters in those states support action. As climate change continues to be a trending 2020 campaign issue, why aren't more elected representatives catching up to the views of their voters?

At Brightest, we believe the climate crisis is one of the greatest challenges of our time. In order to reduce, mitigate, and prepare for the impacts of climate change, we need to know what the most likely effects are, who will feel them, and what we can do about it. We wanted to better understand what the best science says about the impacts of global warming and biodiversity loss, and how that compares to voter sentiment, policy views, and the actions being taken now.
The Geographic Distribution of U.S. Climate Risks and Impacts
Predicting the future is hard, especially with a complex issue like climate change where the potential impacts span air, water, food & agriculture, public health & disease control, rising sea levels & flooding, and damage to environmental ecosystems. Some of the best predictions we’ve seen come from the Climate Impact Lab, an interdisciplinary, non-partisan team of scientists working together on impact forecasting. Their work combines econometrics, climate science, and risk analysis to predict what we’re likely to see in the next century. The Climate Impact Lab describes their approach as:
“The Lab’s researchers combine historical socioeconomic and climate data, allowing the team to discover how a changing climate has impacted humanity—from the ways in which extended droughts have affected agricultural productivity in California to the ways in which heat waves have impacted mortality in India and labor productivity in China.”
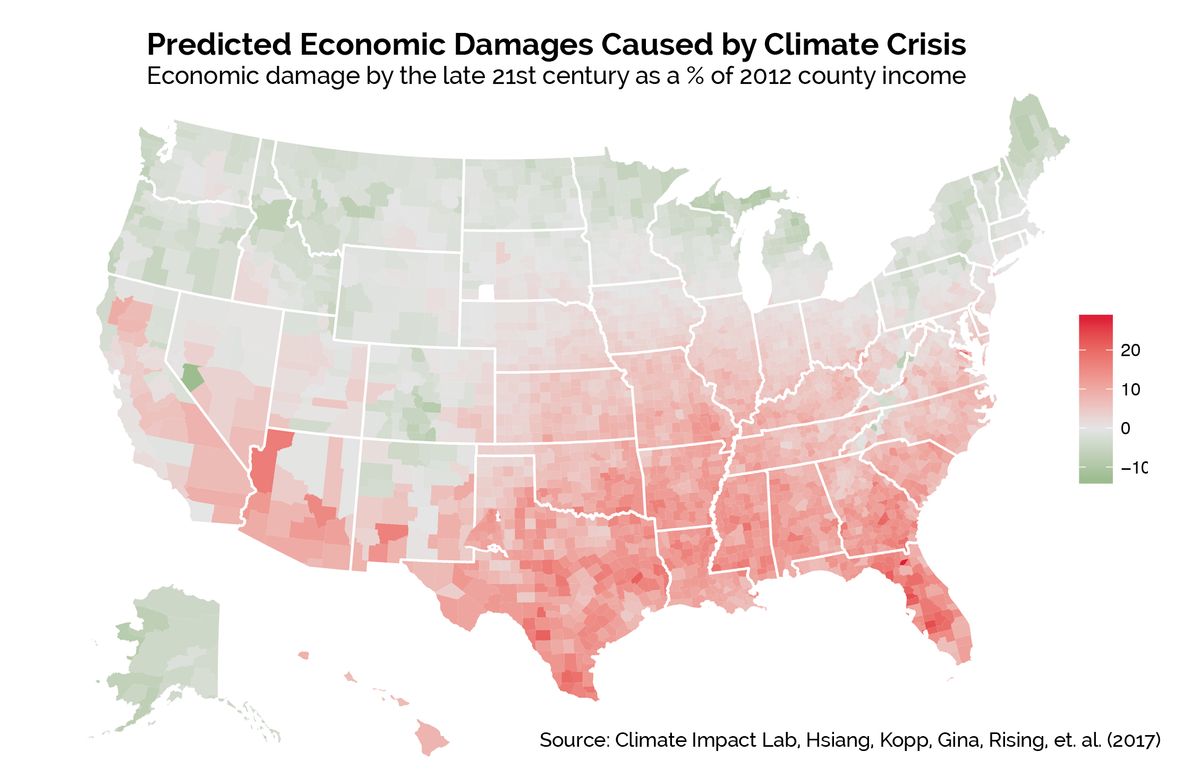
The Climate Impact Lab’s data is also open source (yay for open science!). The economic damage estimates we've mapped and analyzed are based on “Estimating economic damage from climate change in the United States," originally published in the journal Science (Hsiang, Kopp, Gina, Rising, et. al., 2017)1.
Areas shown in red are likely to be worse off as a result of climate change. But, scientists estimate some areas (shown in green) might be better off economically as rising temperatures shift agricultural production further north. We do think it's important to caveat the "economically better off" finding by noting that major storms, plant and animal loss, heat waves, and emissions-driven respiratory diseases like asthma can and will happen in northern parts of America, particularly urban areas, so no part of the country is immune to its effects. These predictions are also under a “business as usual” scenario, meaning emissions stay about the same, and no significant actions are taken to reduce emissions2.
Next, we compared these predicted impacts with actions being taken now to address the climate emergency we’re facing. While the county-level data is useful for a nuanced, detailed view of the impacts, we think it’s most reasonable to compare impacts to actions at the state level to get a broad view of the policies that reach the most people and the biggest geographies.
In order to compare analogous geographies, we needed state level damage predictions. We aggregated the data by taking a population-weighted average of the predicted economic impacts. To check the robustness of the aggregation mechanism we picked, we also looked at a county income weighted average and the results were very similar (most states differed by less than 1%).

Climate Action vs. Climate Policy
Now that we’ve seen the likely impacts, let’s take a look at current actions being taken and policies in place to address the climate emergency we’re facing.
There’s a lot of action happening at the state and local level. We’re especially excited about bills like the Climate Leadership & Community Protection Act (CLCPA) that just passed in New York state. The CLCPA set ambitious emission reduction goals and explicitly earmarked funding for historically marginalized and disadvantaged communities - timing targets we hope (and expect) will continue to get more aggressive so we decarbonize faster (which we need to do). We also like 100% clean energy targets, though only five states (plus DC and Puerto Rico) have made binding commitments so far.
For this comparison, one reference benchmark is the U.S. Climate Alliance, a coalition of states committed to upholding the goals of the Paris Agreement after the federal government formally withdrew from the accord. 24 states (plus Puerto Rico) have joined the coalition3.
U.S. Climate Alliance Principles
1. Implement policies that advance the goals of the Paris Agreement, aiming to reduce greenhouse gas emissions by at least 26-28% below 2005 levels by 2025
2. Track and report progress to the global community in appropriate settings, including when the world convenes to take stock of the Paris Agreement
3. Accelerate new and existing policies to reduce carbon pollution and promote clean energy deployment at the state and federal level.

Now the most startling finding comes when we compare impacts to actions: the states with the most severe predicted damages from climate change are doing the least to address it.
Public Opinion and Climate Policy Preferences
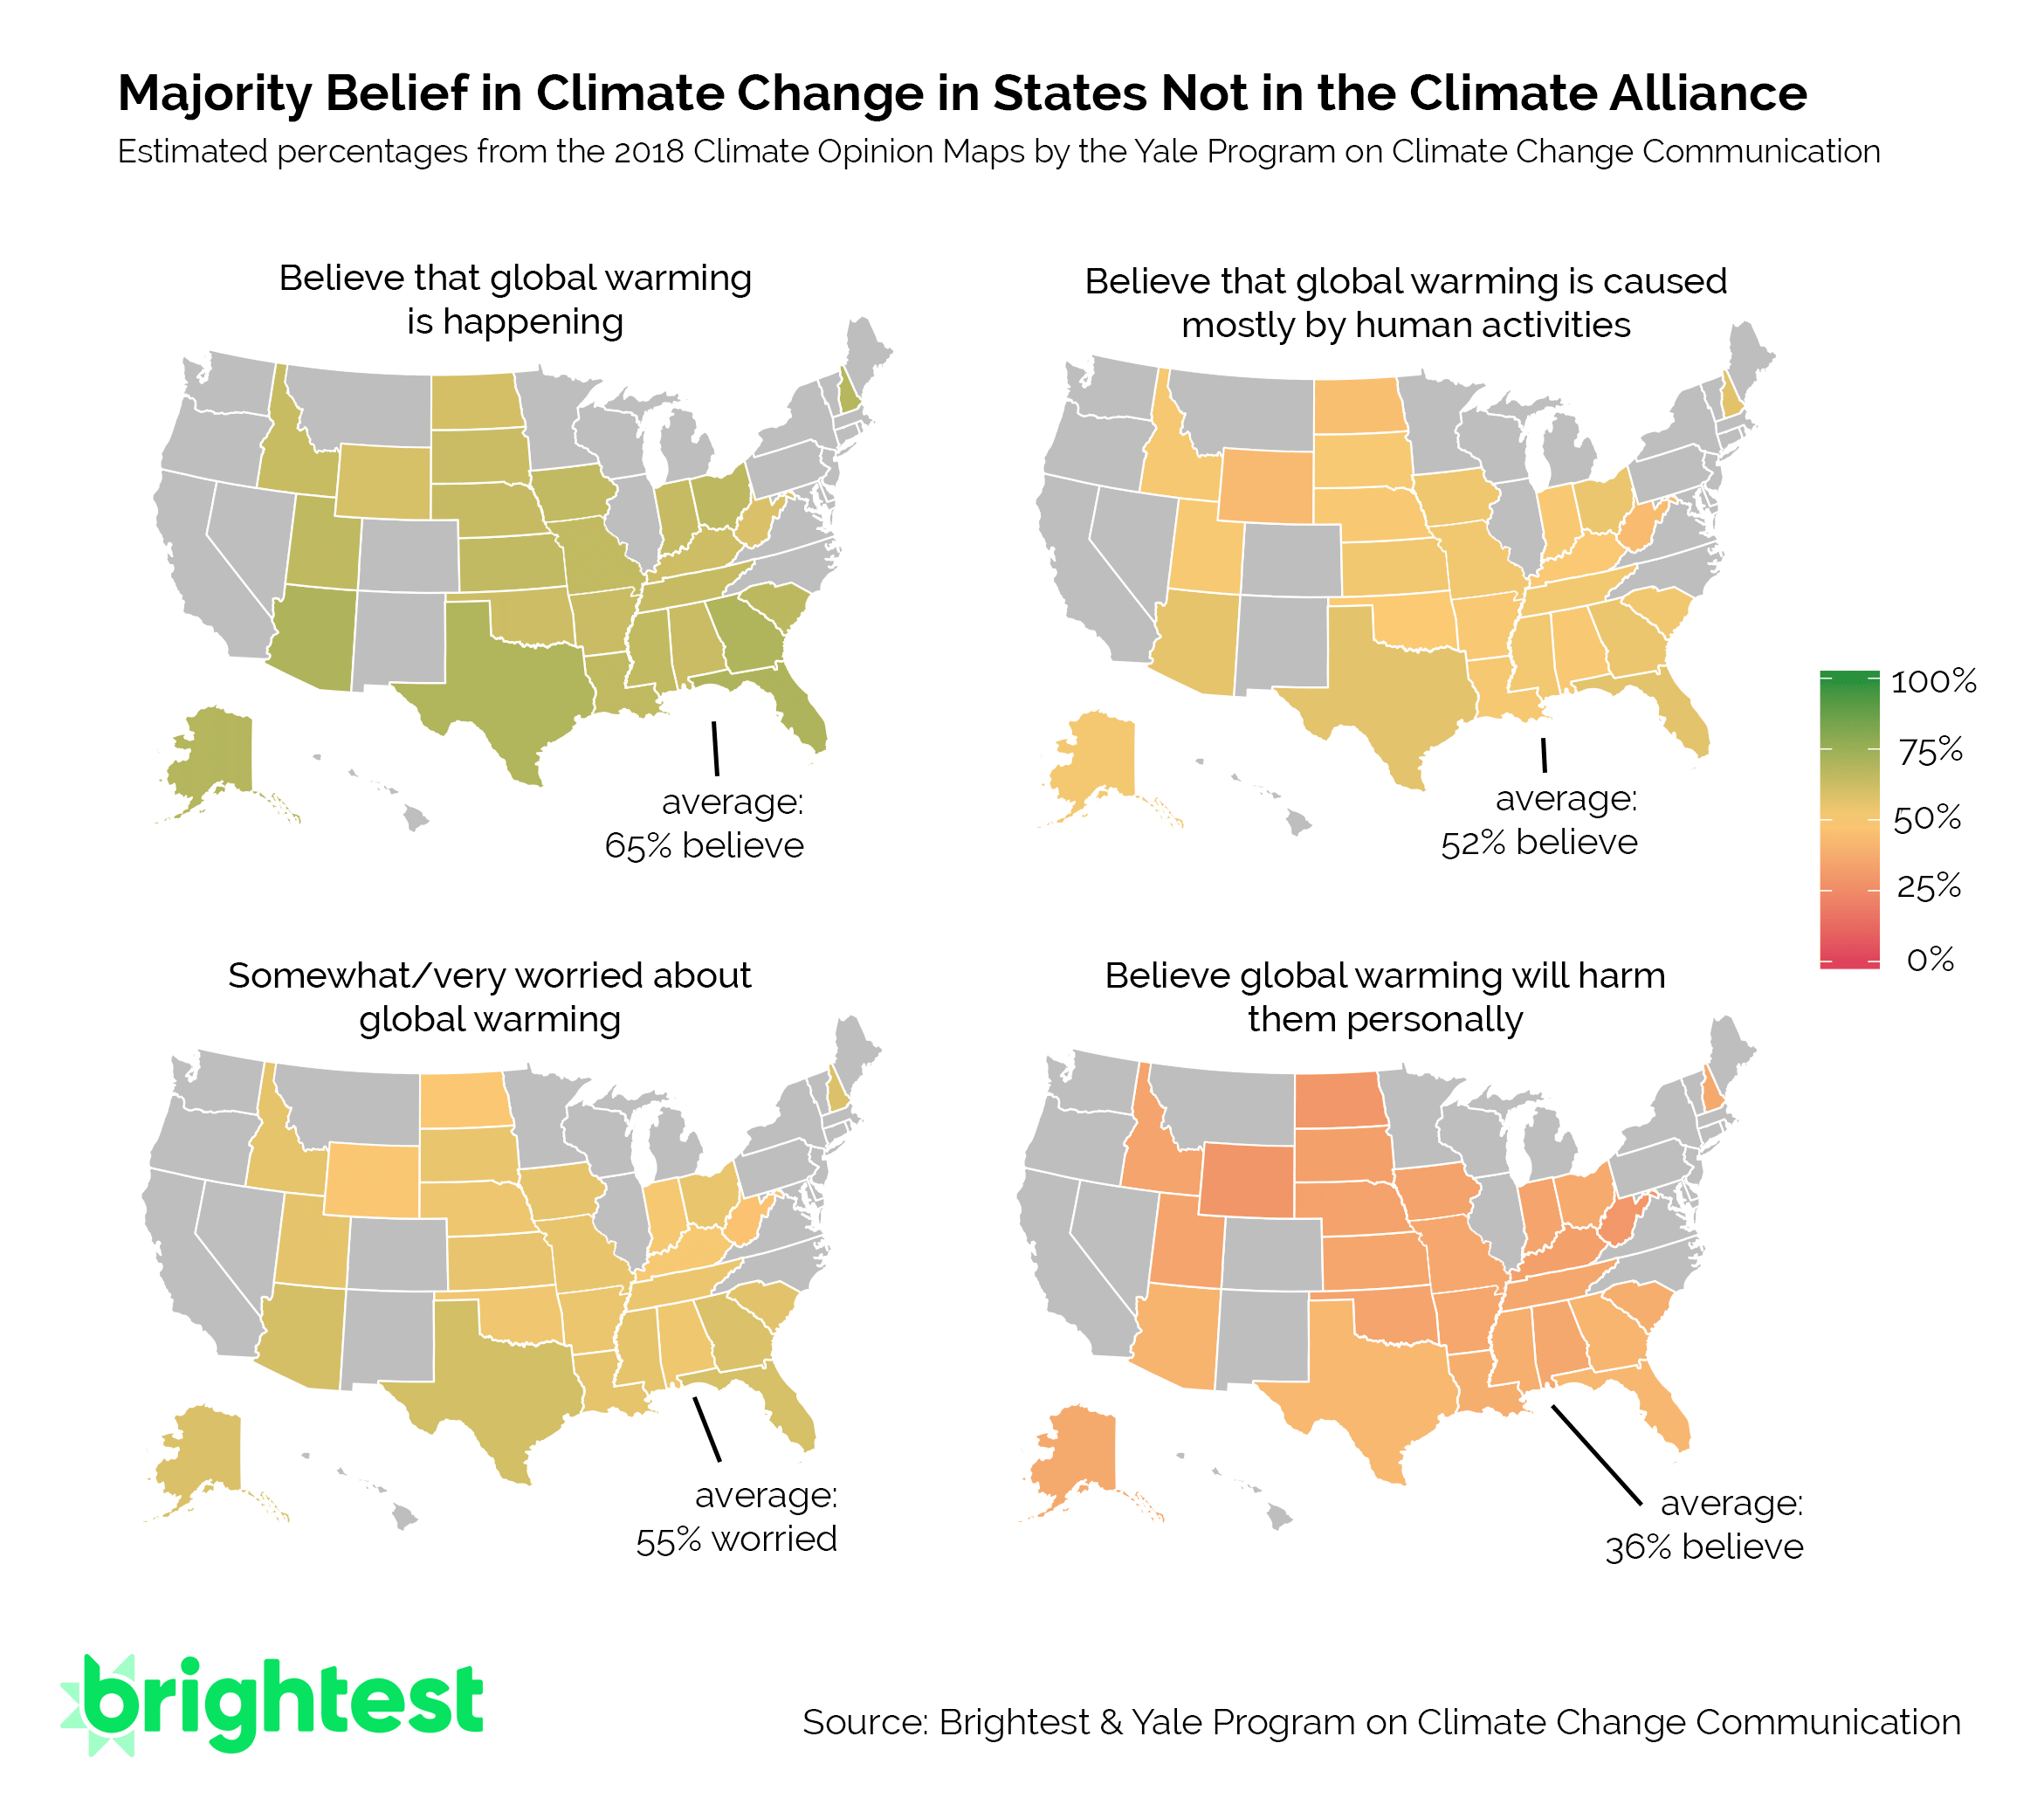
We were curious about how people in these states felt about that inaction - so we looked for public opinion data on climate. The Yale Program on Climate Change Communication does extensive polling and public opinion research to produce climate opinion maps of opinions at various geographic levels.
The Yale estimates show that more than 50% of people in most non-Climate Alliance states believe in climate change, and believe it’s caused by human activities. The data also shows that more than 50% of people in most states are worried about climate change, even though far less believe it will harm them personally. This overall seems to be the biggest perception gap. In predominantly Southern and Midwestern states, 55% of voters say they are "somewhat" or "very worried" about global warming, but may of them still see it as someone else's problem (sooner).
Given that voters in these states believe in climate change and are worried (for the most part) - why the inaction on climate? Maybe people in these states disagree with the most common climate actions and solutions? We wanted to find out.
According to policy support estimates, our data shows more than 50% of people in most states not in the U.S. Climate Alliance actually do support progressive climate policies and believe their governor and other local politicians should be doing more to address climate change.

Most people in these states support climate action - without even realizing that climate change is most likely to personally impact them more than other parts of the country. Our findings suggests there is substantial, untapped public support for action on climate - even in more conservative states. The climate positions of GOP leadership do not seem to represent the majority of their constituencies.
So what can you do? If you live in the Southeast or Midwest, definitely register to vote and consider calling or writing your representatives. We also recommend our free, local climate action search tool to find local stuff to do or groups you could join. Lastly, there are several exciting newer grassroots climate groups like Sunrise Movement, Youth Climate Strike, or Extinction Rebellion now operating throughout the United States who are doing a lot of great work to increase awareness and political pressure on the risks of climate change. Or feel free to organize your own local group or event. As always, we're happy to help you organize.
Whatever you do, please don't do nothing. We need you and we're all in this one together.
Thanks for reading. If you enjoyed this piece or learned something new, do us a favor and share it with others who might benefit from it. Second, we <3 open science! All of the code and data that went into this study is available here and here if you'd like to explore it further.
This essay is from our Data for Climate series, using insights from data and research to inform climate activism and movements for change. To read more, check out the rest of the series here, and follow us on Instagram and Twitter to stay updated.
Note: The YPCCC bears no responsibility for the analyses or interpretations of the data presented here.
Sources
1 Hsiang, S., Kopp, R.E., Jina, A., Rising, J., Delgado M., Mohan, S., Rasmussen, D.J., Muir-Wood, R., Wilson, P., Oppenheimer, M., Larsen, K., and Houser, T. (2017). Estimating economic damage from climate change in the United States. Science. doi:10.1126/science.aal436
2 “Business is usual” here is defined as Representative Concentration Pathway 8.5. You can read more on RCP 8.5 here.
3 “Alliance Principles”. U.S. Climate Alliance. https://www.usclimatealliance.org/alliance-principles
4 Howe, P., Mildenberger, M., Marlon, J., & Leiserowitz, A. (2015) “Geographic variation in opinions on climate change at state and local scales in the USA,” Nature Climate Change. DOI: 10.1038/nclimate2583.


